Slack-to-Fix Pipeline for Agent Incidents
Categorized alerts route agent failures to the right fix faster.
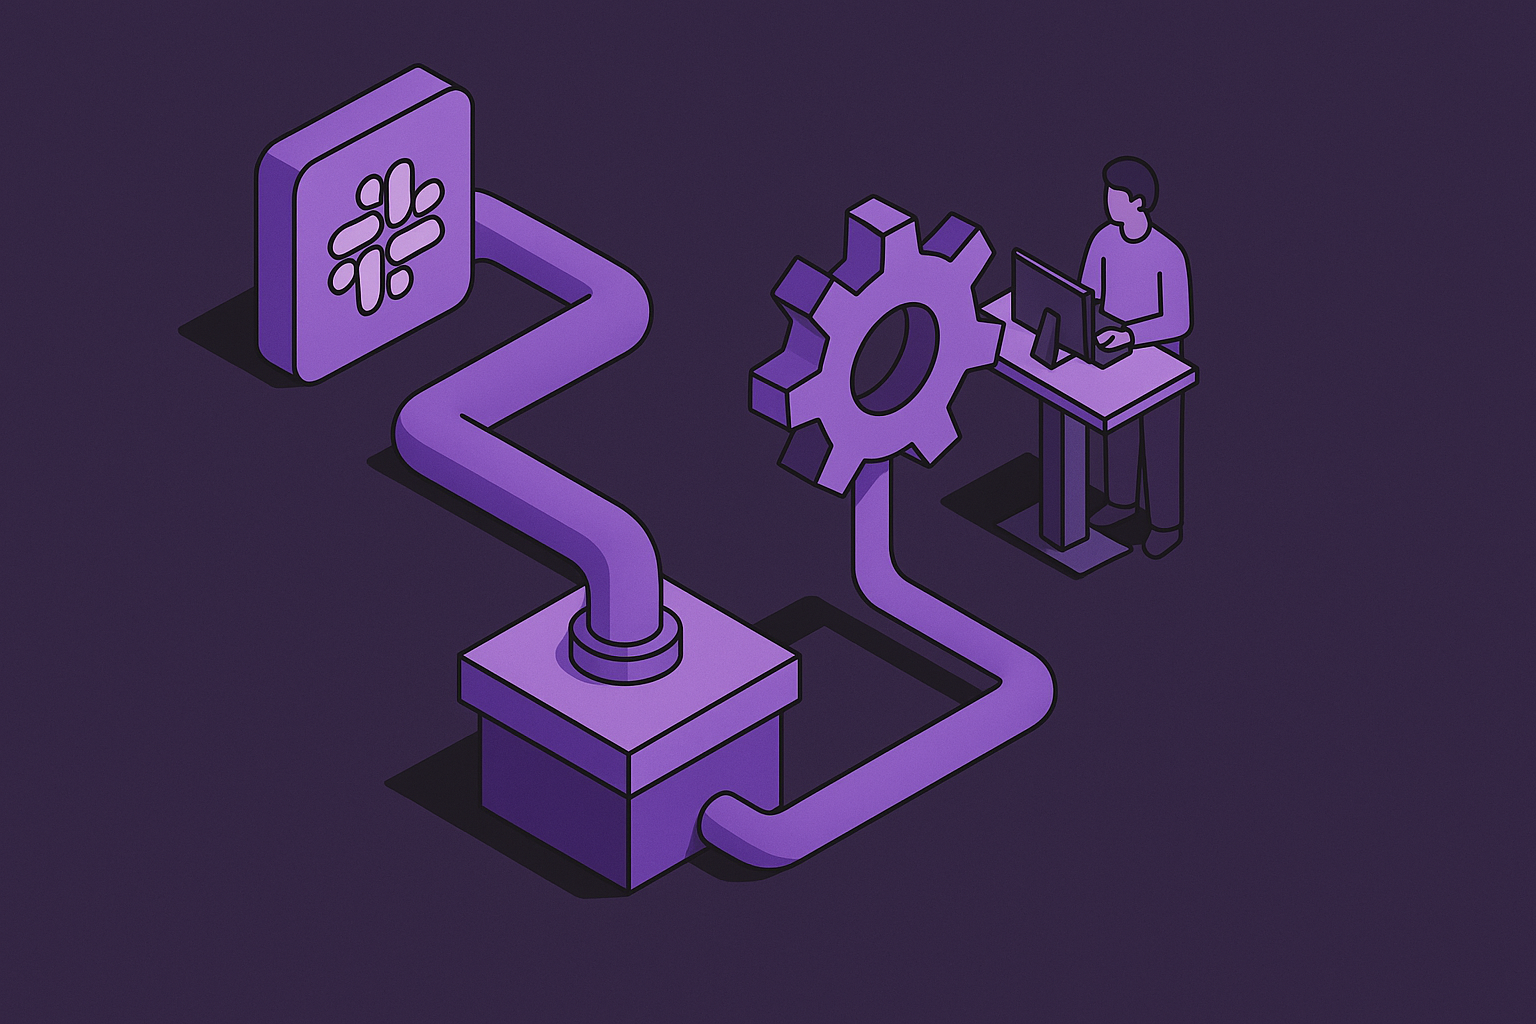
An agent fails quietly, and the people responsible for fixing it find out through Slack, not through the monitoring stack built to catch exactly this kind of problem. That gap, between the place a failure becomes visible and the place someone can actually act on it, is the structural problem this piece is about. It is a workflow problem, not a tooling gap: the alert, the diagnosis, and the fix often live in three different places, and every inch between them costs time while the agent keeps running and doing the wrong thing. When a failure does finally surface, whether through a user complaint, a metric that dropped, or a colleague flagging something odd, the first artifact anyone sees is a Slack message. The response starts there no matter where the underlying tooling sits, so the quality of that first message, and what happens after someone reads it, determines how fast the incident actually closes. A Slack-to-fix pipeline is the direct answer to the distance between surfacing and fixing, and building one that works means treating alert quality, failure categorization, and workflow integration as one connected system instead of three separate features bolted together.
Why silent failures are structurally guaranteed, not edge cases
Silent failure in agent systems is not a bug that better testing removes. It follows from how these systems are built, and it appears whether the architecture is simple or elaborate, whether the model is small or frontier-scale, whether the task is narrow or open-ended. Research covering more than 40,000 controlled trials and long-term production data spanning over 100,000 agent interactions found that these failures happen under completely normal conditions, with no external trigger, no injected error, and no resource limit being hit. You only see them through systematic measurement applied after the fact, because no alert a conventional monitor was built to fire catches them. The Entropy Principle research names this precisely: disorder in agent output, the steady loss of output consistency, task accuracy, and coherence across sessions, grows as interaction rounds pile up, across different architectures, different models, and different kinds of tasks. The pattern is not confined to one framework or one vendor's implementation.
Consider what this looks like in practice: an agent visits four accounts that no longer exist, logs "no action needed" on each one, and reports a completed run. It does this for forty-two straight days while the metric it exists to move sits flat the entire time. Nothing crashes. No error code fires. The run completes, the log looks clean, and the only evidence something is wrong is a business metric that refuses to budge, a signal several layers removed from the agent's own reporting. The failure is real. The system produced no signal an engineer could act on, and that gap between occurrence and detectability is the entire problem.
Agent non-determinism makes the problem harder to close through ordinary debugging. The same input can trigger a different sequence of tool calls on different runs, so a failure that occurs on run 47 may simply not reproduce on run 48. The usual loop (reproduce the bug, fix it, confirm the fix) doesn't close the way it does with deterministic code, because there may be nothing stable to reproduce. Several of the most common failure types compound this by looking identical to normal operation from the outside. Context overflow is one: once an LLM hits its token limit, the framework truncates the oldest messages with no signal that anything was lost, and the agent keeps producing output that is simply wrong in ways no health check is built to catch. Credential drift is another: agents running continuously can end up holding stale OAuth tokens or expired API keys, which causes tool calls to fail silently while the agent keeps executing and the outputs keep coming out wrong, with no health check ever tripping. A third pattern, documented in Scale AI's interaction-centric taxonomy of agent failures, is false-success reporting, where an agent reports that a tool call succeeded when it actually failed. In each case, what the agent says it did and what actually happened come apart, and the agent has no mechanism to notice the gap on its own. Conventional monitoring, built to catch crashes, timeouts, and error codes, is simply pointed at the wrong layer to see any of this.
What a useful agent alert contains
"Agent run failed" tells an engineer almost nothing. A useful alert needs to say what the agent was trying to do, what it did instead, and what category of failure produced the gap between those two things. Without that context, the engineer receiving the alert has to rebuild the whole picture from scratch: pulling traces, reading through system prompts, re-running the sequence by hand, before diagnosis can even start. The alert is the first handoff in the entire pipeline, and if it loses information at that first step, every step after it moves slower and gets less accurate.
Agent failures cluster into a limited number of recognizable categories, and which category a failure falls into determines which part of the system the fix belongs on. That makes categorization part of what the alert itself needs to contain, not a separate step performed after someone starts digging. An alert that blurs categories together sends the fix to the wrong place: a problem that needs a planner-side patch doesn't belong in front of an output scanner, and the reverse is just as wasteful. Scale AI's interaction-centric taxonomy pushes this further by pointing out that the same visible failure can call for different fixes entirely, whether that's retraining the model, reworking the harness, redesigning the environment, or repairing the benchmark itself, depending on where in the system the fault actually originated. That means a good alert has to localize the fault to a specific component rather than simply describing the symptom on the surface.
The cost of getting this wrong is concrete. One planning-layer infinite loop burned significant cost over an extended stretch of time, because nothing in place was watching for the same tool firing repeatedly with near-identical arguments. Had an alert existed for it at all, it would have described the symptom, a stuck process, without ever naming the layer where the actual defect lived. Recurring failures also need to be grouped before they hit the alert channel, not after someone notices the channel is full of near-duplicate messages. A channel full of individually logged failure events is just noise. Grouped and categorized issues are signal an engineer can act on. Automatic grouping of traces into recurring patterns changes what an engineer sees: instead of forty separate Slack messages, they see one line stating that a given failure mode has occurred across some number of traces in the last hour, and they can triage the pattern directly instead of working through each instance one at a time.
Turning a Slack alert into a repair assignment
A categorized alert does more than describe a problem. It tells the engineer whose problem it is and where the fix needs to happen. Planning errors go to the planner prompt and the cycle detector, tool errors go to the tool allowlist and the schema guard, retrieval errors go to the retriever rubric and the chunker, reasoning errors go to the generator and the calibration set, and policy violations go to the output scanner. Skip that routing, and the Slack message just opens a triage conversation, with someone asking who owns this and where it should go. Include it, and the same message starts an actual repair.
As the failure surface grows, the set of categories an alert needs to recognize keeps growing with it. The Microsoft AI Red Team's updated taxonomy of agentic AI failure modes, building on an April 2025 publication and a year of red team engagements, added seven new categories, a shift driven in part by how fast vulnerabilities in the Model Context Protocol ecosystem have multiplied: 99 CVEs were reported against MCP in 2025 alone. Two of the new categories, MCP/Plugin Abuse and Agentic Supply Chain Compromise, need security-team involvement, and the fix workflow for them looks nothing like fixing a prompt regression. Routing both into the same channel with the same alert format erases a distinction that matters operationally. Session Context Contamination, where data from one session leaks into another session's response, needs a fix at the memory layer, not a change to the model. If you treat it as a reasoning error instead, the repair cycle gets spent in the wrong place. The point isn't to catalog every category here, but that a static alert format goes stale fast, because the taxonomy of what can go wrong keeps expanding alongside the systems themselves.
Categorization pays off a second time at the postmortem. Naming the failure category in the incident review turns the failure cluster into a labeled entry in a dataset that the next pull request has to clear before it ships. Naming it means the fix comes with evaluation coverage behind it, so the same failure can be caught before it comes back. The incident review generates something the codebase can check against going forward, instead of staying a conversation about what happened.
What the workflow integration layer must do beyond Slack
The hardest part of this pipeline is the last stretch of it. An engineer who gets a categorized, specific alert in Slack and then has to open a separate console, log in again, and manually pull the trace has already lost the easy path the alert just created. That context switch is the exact moment engineers decide to defer an incident, hand it off to someone else, or let it drop, especially when the failure doesn't look urgent in the moment. Silent agent failures almost never look urgent at first glance: the agent is still running, nobody has complained yet, and what's actually wrong is a pattern spread across many traces rather than one loud, obvious event. The harder it is to go look, the easier it becomes to tell yourself it can wait.
Coding agents have made it realistic to do the actual diagnostic work without leaving the editor. Connecting an observability backend directly into editors such as Cursor, Claude Code, Windsurf, and VS Code through MCP-native integration lets an engineer pull traces, check experiment results, and run comparisons right where they're already writing code, with no separate login and no separate tab.
Automated remediation is turning into a standard part of how teams run agents at scale; it isn't just an experiment a few advanced teams try. The pattern looks like this: a reliability agent watches the trace spans produced by the primary agent, catches a known failure mode such as a loop, an auth error, or a cascading failure, and hands off to a remediation sub-agent carrying a narrow, fixed set of tools, closing the loop without a human needing to kick off every single repair by hand. The CASE framework's supervisory cybernetics layer explains why this has become necessary rather than optional: the Law of Requisite Variety shows that a human team simply cannot absorb the full range of behavior a deployed agent system generates at scale, so automated remediation becomes a structural requirement for keeping the system governable once volume passes a certain point, not a convenience. That power needs a boundary. A remediation sub-agent needs a tightly constrained toolset, clearly defined conditions for rolling back, and a path to escalate to a human once a failure crosses a defined risk threshold. Without those limits, the remediation agent turns into a second failure surface sitting on top of the first one.
A three-tier evaluation setup is what closes the loop between the Slack alert and the regression coverage that should follow it. Fast checks run on every pull request to confirm the agent calls the right tools. Nightly regression suites use an LLM as judge to assess the quality of what the agent produced. Continuous production monitoring watches for drift in how the agent performs over time, fires the Slack alert, and feeds its output directly into the next night's regression run. Trace-to-dataset loops make this automatic: production failures turn into evaluation data without anyone manually exporting anything, and every incident leaves behind regression coverage beyond a closed ticket. This matters because agent regressions rarely look like infrastructure incidents. A quality score can drop for a single prompt or a single use case and stay completely invisible in an aggregate chart, even as it causes real harm to the people relying on that one use case.
Building the pipeline: how alert quality, categorization, and workflow integration fit together as a system
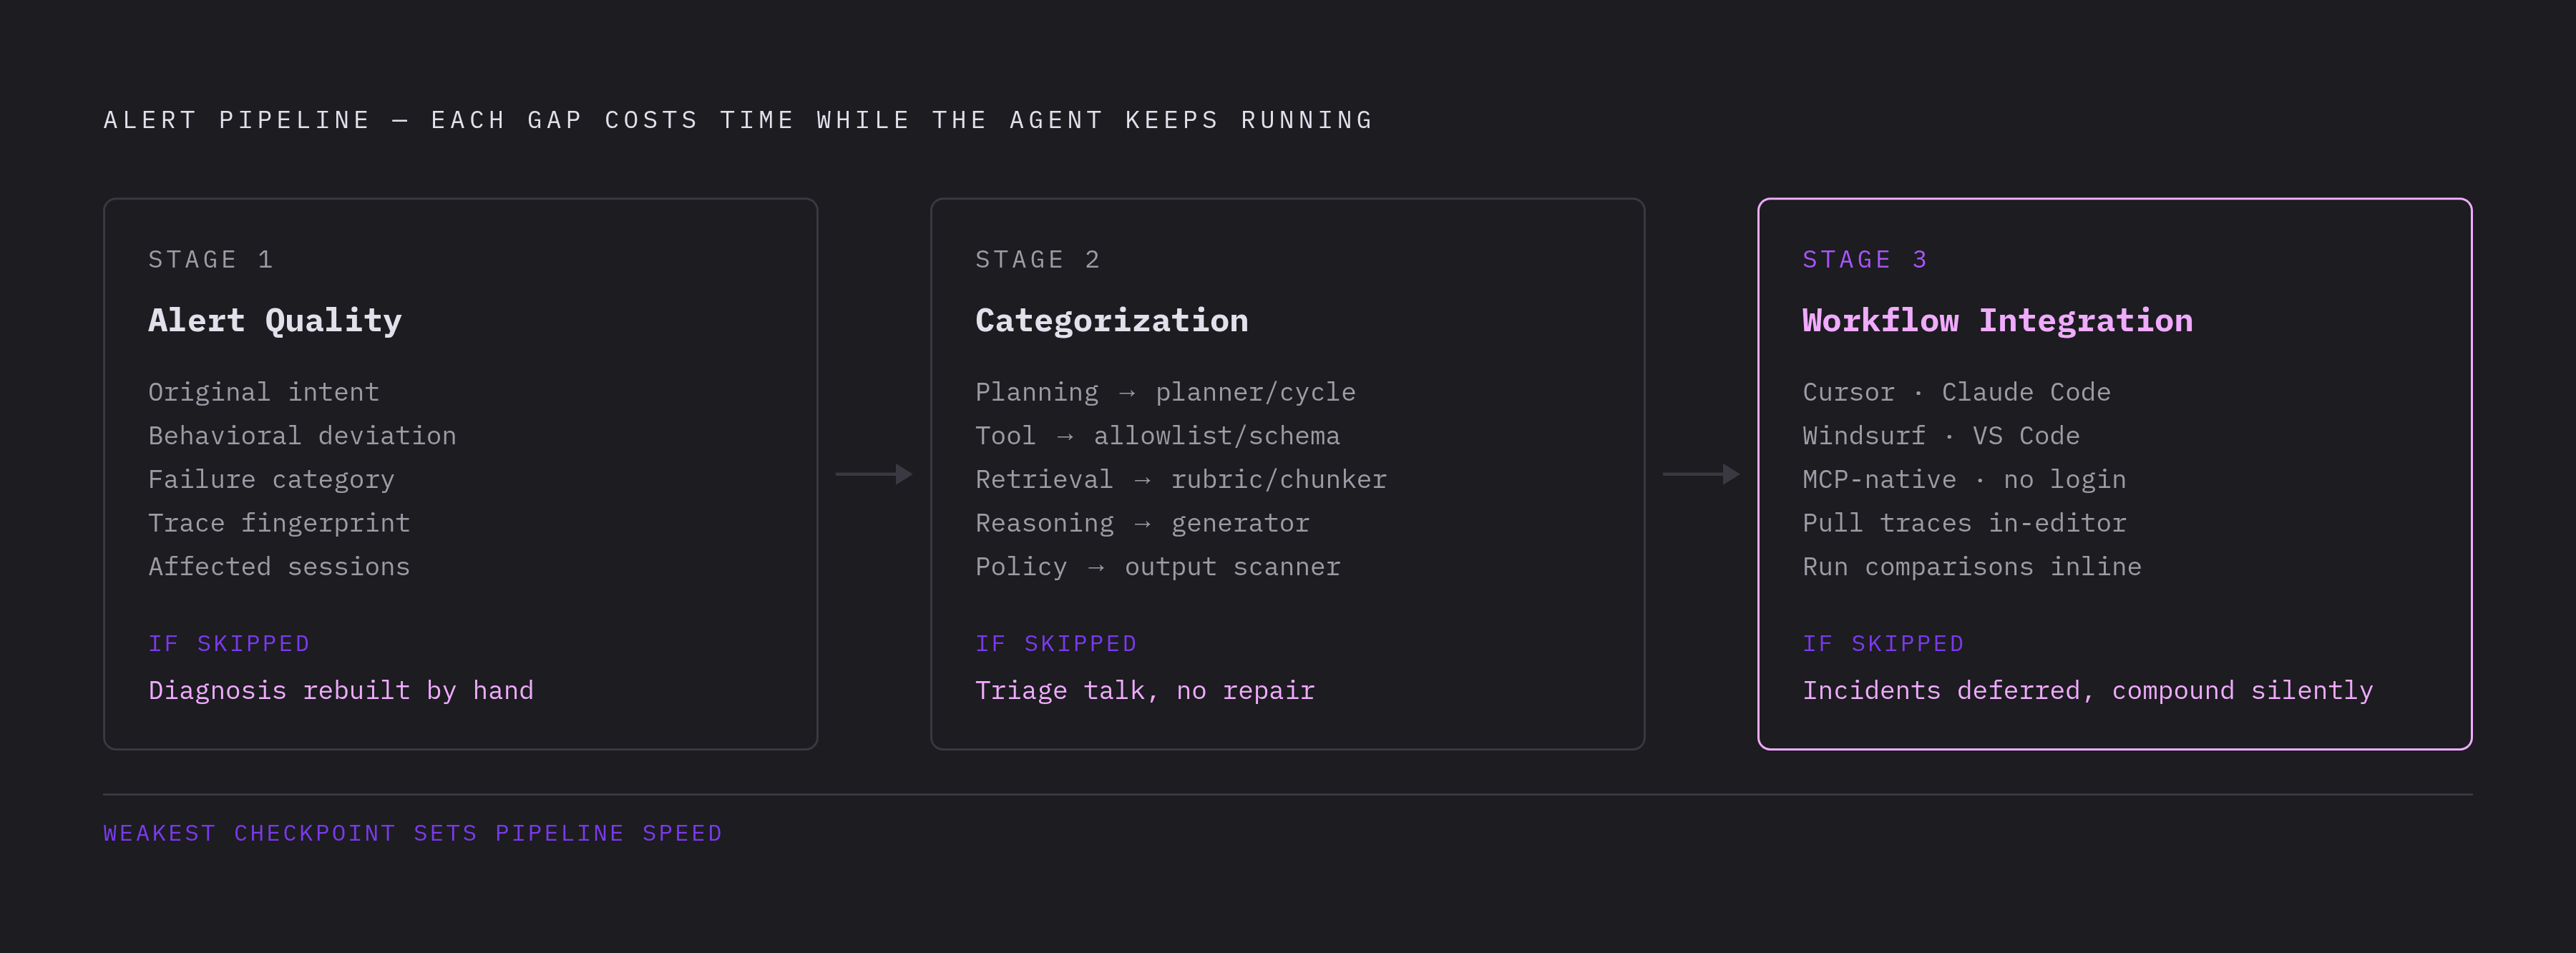
None of these three pieces works well on its own. A high-quality alert with no categorization behind it still only opens a triage conversation; it does not assign a repair. Categorization without workflow integration creates a handoff where the information exists but the engineer still has to go somewhere else to use it. If workflow integration has no alert quality behind it, the engineer just gets to incomplete information faster, and that doesn't help. The three have to be designed together, as one system, rather than shipped as three separate features that happen to sit next to each other.
A useful way to build it is around three checkpoints asked in order: what does the alert contain, what does the category make possible, and what can the engineer do without leaving the context they're already working in. Each checkpoint fails in its own distinct way if it's skipped. Noisy alerts train engineers to tune the channel out. If failures get miscategorized, fixes go to the wrong surface, so the repair cycle gets wasted on the wrong team or the wrong code. Friction in the workflow causes exactly the incidents that look unimportant, but are quietly compounding in the background, to get deferred past the point where they're easy to fix.
The alert quality checkpoint sets the floor everything else builds on. An alert worth acting on needs to state the agent's original intent, how its behavior deviated from that intent, which failure category the deviation falls into, a fingerprint identifying the trace, and how many users or sessions were affected. Without intent context, the engineer is rebuilding the diagnosis from the trace data by hand instead of confirming a diagnosis the system has already worked out and handed to them. Get that first checkpoint right, and the categorization and workflow layers built on top of it have something solid to work with. Routing logic and editor integration downstream cannot make up for a Slack message that doesn't say what actually happened.
Sources
- Microsoft Updates Taxonomy of AI System Failure Modes
- Silent Failure in LLM Agent Systems: The Entropy Principle and the Inevitable Disorder of Autonomous Agents
- Model or Harness? An Interaction-Centric Taxonomy for Localizing Agent Failures
- The CASE Framework: A Multi-Disciplinary Control Architecture for Governing Enterprise Agentic AI